Les nouveaux usages d'aujourd'hui seront les business de demain.
Revue de presse sur les tendances et évolutions technologiques utiles.
http://theitwatcher.fr/.
Google Earth Engine Brings Big Data to Environmental Activism
A lire sur: http://spectrum.ieee.org/energy/environment/google-earth-engine-brings-big-data-to-environmental-activism By Eliza Strickland
Posted
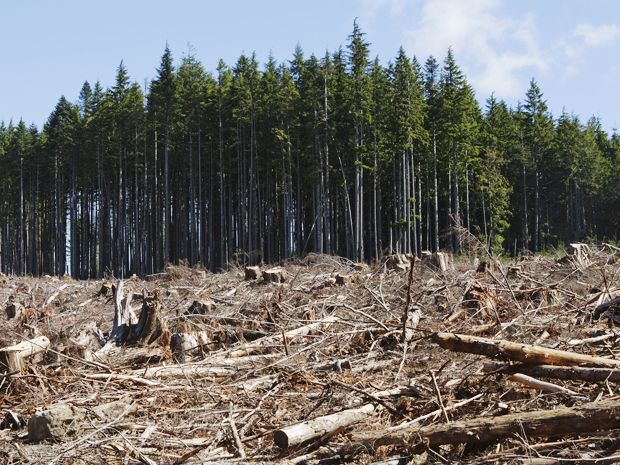
Photo: David Mantel/Getty ImagesWatching the Woods: A new mapping tool uses satellite imagery to keep an eye on the world’s forests from above.
When a tree falls in the forest these days, it doesn’t just make a sound—it causes a computer program to generate an alert that’s sent out to activists, researchers, and environmental policymakers around the planet. An online tool to map deforestation is applying big-data processing techniques to massive troves of satellite imagery, and in the process it is making possible a new kind of environmental activism.
The tool, Global Forest Watch, was launched by the World Resources Institute in February to provide monitoring of deforestation around the world. Users can explore the global map to see trends since the year 2000 and can zoom in to examine forest clearing at a resolution of 30 meters. The tropical zones of the map are refreshed every 16 days, frequent enough to track deforestation hot spots in places like Indonesia and Brazil. Users can also sign up for alerts, which are generated when the system detects signs of illegal logging or slash-and-burn agriculture in the tropics.
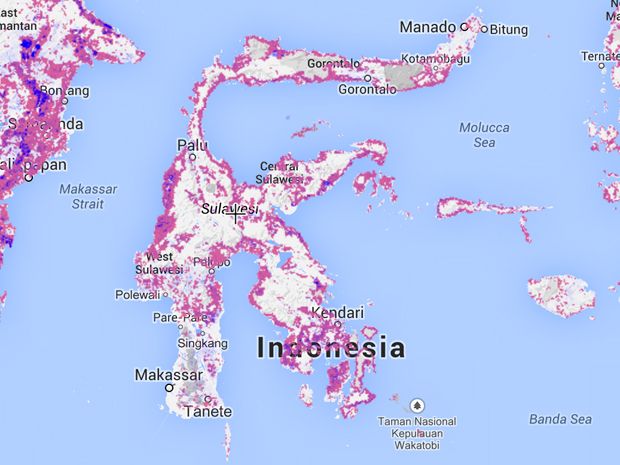
Photo: Global Forest WatchTrouble in Indonesia: Global Forest Watch shows deforestation in Indonesia, where land is often cleared for palm oil plantations.
The site is powered by Google Earth Engine, which crunches image data drawn from several NASA and U.S. Geological Survey (USGS) satellites. Google is developing this platform to host petabytes of Earth science data and to give researchers a straightforward way to use it. “They log on, access all the data, and run their own algorithms,” explains David Thau, the senior developer advocate for Google Earth Engine. Thau and his colleagues work with scientists to develop useful analysis functions, and then they “get out of the way,” he says, and let researchers conduct their investigations. Google Earth Engine is currently available to thousands of research partners, and the company plans a general release down the line.
Global Forest Watch is the result of a convergence of projects. The World Resources Institute’s Data Lab had been working on a forest-clearing-alert system for the tropics based on data from MODIS (Moderate Resolution Imaging Spectroradiometer), instruments that ride aboard NASA’s Terra and Aqua satellites. Meanwhile, Matthew Hansen, a professor of geographical sciences at the University of Maryland, had been collaborating with Google Earth Engine on a global map of deforestation; his project used images from the Landsat satellites operated by NASA and the USGS. Both data sets are now used to create Global Forest Watch; MODIS provides better temporal resolution, while Landsat provides exemplary spatial resolution.
The researchers’ algorithms create the site’s dramatic map of forest loss using the satellites’ visible light and infrared data. Each pixel of satellite imagery is characterized by both its color and its infrared signature, and the algorithms then compare the data for that pixel across time to detect changes. A switch from green to brown, for example, is a bad sign. Hansen pioneered this technique in his earlier research on land use in the Congo Basin, where the ground was very often obscured by clouds. Rather than throw out the cloudy images, Hansen developed ways to create composite pictures using many days’ worth of images. “We learned how to work pixel by pixel,” he says.
When Landsat data became freely available in 2008, Hansen worked with Google Earth Engine to apply his model globally, looking at 143 billion pixels of 30 meters each. By tracking the pixels over months and years, the model corrects for seasonal changes to forests and can distinguish between crops and woodlands. The collaborators published their results last November, revealing a net loss of 1.5 million square kilometers of forest between 2000 and 2012. Those calculations, the researchers noted, took 1 million CPU-core hours on 10 000 computers.
Thau says that Google Earth Engine aims to take the pain out of this big-data research. In typical cloud computing, he says, researchers have to manage the distribution of their computing tasks across the network. With Earth Engine, however, researchers simply use a programming interface to enter their queries, which get “parallelized” automatically, Thau says.
By creating the public-facing Global Forest Watch website, the World Resources Institute aims to give the public access to all that big data too. Dan Hammer, chief data scientist at the organization’s Data Lab, says he expects that government agencies, businesses, researchers, and advocacy groups will use the site to get a better picture of forest management.
At the environmental action group Rainforest Action Network, agribusiness campaigner Gemma Tillack says the new tool may be particularly useful in Indonesia, where rain forests are falling to make way for palm oil plantations. Her group is asking 20 big food corporations toguarantee that the palm oil used in their products is being grown on legal, sustainable plantations. Some companies are establishing responsible palm oil procurement policies, she says, and Global Forest Watch could help them implement those policies. “They need to find out where the palm oil they’re buying is coming from, and then they’ll need to monitor the actions of their supply-chain partners,” she says.
Time will tell if the site will make any difference in the seemingly inexorable advance of bulldozers, but Hammer is optimistic. “I’m consistently surprised by how much open access to data can fix things in the world,” he says. Many policy decisions are delayed by arguments over conflicting information, Hammer notes, but the objective data provided by Global Forest Watch has the potential to eliminate such confusion. “That would let people get to the hard questions about what should be going on in the forests rather than what is going on,” he says.
A correction was made to this article on 16 April 2014.
Aucun commentaire:
Enregistrer un commentaire